Data Analytics is the process of cleaning and processing data to gain valuable insights from it. Nowadays, this is done using software like Microsoft’s Power BI, Tableau, Python and R. Data mining is a similar term that refers to the processes used to detect and analyze patterns in data through Machine learning, Artificial intelligence and statistical methods.
+91 9446355222
Data Analytics
Data Analytics
Data analytics is becoming increasingly important to businesses everywhere, as it uses the raw data gained from an organization to make better business decisions. Sales data can be analyzed to see which product or service is making a loss.
Product recommendations can be offered to customers based on analysis of their purchases, cart, wishlist or simply their product browsing habits. Banks can detect suspicious activity using Machine learning and send alert mails or SMS to customers so that they can take action. Social media platforms like Facebook and WhatsApp use Machine learning to detect fake news and block fake accounts, which is a major issue at the moment. Retailers can analyze their sales data and make predictions on what their sales and profitability will be, a few years from now. Logistics companies can see the top 10 affected shipments and for what reasons. Factories can use their data to make their machines and processes more efficient. Thus, data analysis is useful for companies in every sector.
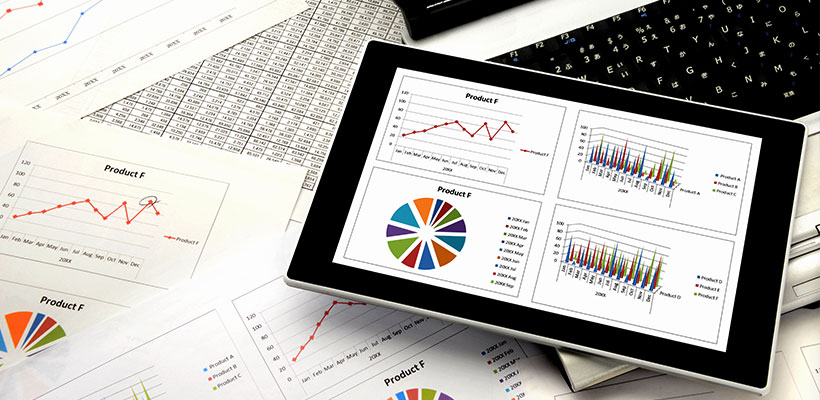
Power BI and Tableau are used for graphic visualization of the information gleaned from data. It can be in the form of various charts like bar, line, ribbon, pie, donut, ribbon, gauge, map etc. Charts and tables are arranged in dashboards along with text and filters. A report can have several dashboards that tell a story about your data. Reports can be presented as is or uploaded to servers for online presentation. Reports can also be exported as a PowerPoint file for presentation at business meetings. They can also be embedded in client websites. Reports remain interactive in all formats except PowerPoint. This means that we can change the values of the filters and see the report update immediately. Power BI and Tableau use their own scripting languages to perform calculations and data cleansing.
R and Python are scripting languages used for building Machine learning models and for Data mining. These can be used to detect patterns in data and make predictions for the future of a company. R is now the most preferred language of choice for data science and statistics.
Unlock the ultimate power of data by deriving insights from it. At Brahmaa Infotek, we help you to drive your sales and marketing by converting data to the right decision. Experience the next generation analytics with Brahmaa Infotek. Our data analytics experts in Cochin derives accurate decisions from the data that helps to drive your sales and to thrive in the digital economy. We at Brahmaa Infotek – the best data analytics solutions provider in Cochin, can help you take crucial business decisions with our bespoke analytics solutions.


